Engagement Rate
Tech Terms Daily – Engagement Rate
Category — SOCIAL MEDIA MARKETING
By the WebSmarter.com Tech Tips Talk TV editorial team
1 | Why Today’s Word Matters
Gen-AI tools can churn out endless posts, ad CPMs are inching upward, and brand feeds are noisier than rush-hour traffic. In this climate, Engagement Rate (ER) is the north-star metric that tells you whether your content is sparking conversation or just adding to the static.
- A Sprout Social 2025 benchmark study found that brands with an ER ≥ 5 % enjoy 2.4 × higher organic reach as algorithms reward content that triggers likes, comments, shares, and saves.
- Gartner reports that every percentage-point rise in ER correlates with +18 % lift in attributable revenue from social channels, because engaged audiences click through and convert at far higher rates.
Treat engagement as a living feedback loop—fuel for algorithms, proof of relevance, and a proxy for trust—and you’ll turn followers into customers and customers into evangelists. Ignore it, and you’ll keep shouting into the void while your paid budget balloons to reach the same people for whom you could have become a daily habit.
2 | Definition in 30 Seconds
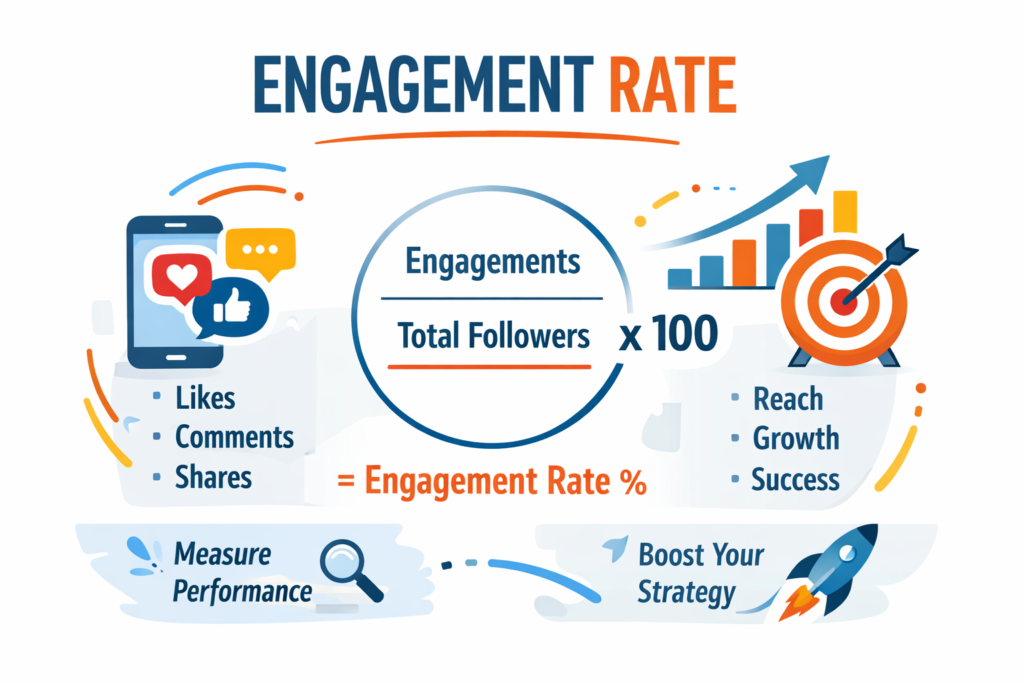
Engagement Rate is the percentage of an account’s audience or post viewers who actively interact with a piece of content within a given time window. “Interact” may include likes, reactions, comments, shares, video completions, saves, link clicks, or even profile taps—depending on platform and goal. The two most common formulas:
- Engagements ÷ Impressions × 100
Shows how scroll-stopping a post is in the feed. - Engagements ÷ Followers × 100
Helpful for benchmarking brand accounts against each other.
Think of ER as a conversation-to-audience ratio: it measures how many people raise their virtual hand instead of scrolling past.
3 | How Platforms Calculate (and Weight) Engagement
| Platform | High-Value Signals (2025) | Low-Value Signals | Weight Trend |
| Saves, shares to DM, carousels swiped | Likes without hold, passive views | Saves > Shares > Comments | |
| TikTok | Full-length views, re-watches, shared to friends | 2-second scroll/trend hashtag | Watch time growing in weight |
| Comments ≥ 5 words, Reposts with commentary | Reactions only | Comments now 2× value of reactions | |
| X/Twitter | Quote tweets, thread replies | Simple likes | Bookmark metric added 2025 |
Understanding each platform’s secret sauce lets you optimize ER for quality, not vanity.
4 | Key Benchmarks That Matter
| Industry | IG Avg. ER / Post | TikTok Avg. ER | LinkedIn Avg. ER | Source |
| B2C E-Commerce | 1.5 % | 5.8 % | 0.55 % | SocialInsider 2025 |
| SaaS / B2B | 1.2 % | 4.1 % | 1.1 % | Sprout Social 2025 |
| Creators | 3.4 % | 8.0 % | 1.9 % | RivalIQ 2025 |
Rule of thumb: If your ER is ≥ 2× the vertical average, algorithms will notice and push content to non-followers.
5 | Five-Step Blueprint to Boost Engagement Rate
1. Audit Baseline & Spike Content
Pull the last 90 days of posts; rank by ER. Note themes, formats, and posting times. Double down on what already spikes interaction.
2. Craft Thumb-Stopping Hooks
- Vertical video first 2 seconds: motion + bold text.
- Carousel post slide 1: promise transformation (“Swipe to see before/after”).
- LinkedIn opening line: pain point + cliffhanger (“Ever lose a $50 K deal because of this one email?”).
3. Incentivize Meaningful Actions
Ask specific questions that invite story-length answers, not “Thoughts?”. Run polls that feed the next content piece and tag contributors in follow-up posts.
4. Optimize Timing & Cadence
Use platform analytics to find when your engaging followers (not just all followers) are online. Post then. Generally:
- TikTok & IG Reels: evenings/weekends mobile downtime
- LinkedIn: Tuesday–Thursday 8–11 AM local business hours
5. Close the Loop with Community Management
Reply to 100 % of substantial comments within 24 h; start micro-threads. Each reply counts as another engagement and signals conversation health.
6 | Common Pitfalls (and Fast Fixes)
| Pitfall | ER Impact | Quick Fix |
| Hashtag stuffing | Looks spammy, lower reach | Use 3–5 niche + 1 branded on IG; 1–2 on LinkedIn |
| Posting only promotions | Engagement fatigue | Adopt 60/30/10 value-story-promo ratio |
| Ignoring video captions | Silent scrollers tune out | Burned-in subtitles boost watch-time 25 % |
| Over-editing comments | Users see hidden replies | Moderate only abusive content (platform guideline) |
| Misaligned CTAs | Low clicks despite likes | Match ask to stage—meme ≠ sales link |
7 | Five Advanced Tactics for 2025
- AI-Generated Comment Starters
LLM drafts personalized replies at scale; social managers edit & post—triples comment velocity without sounding robotic. - Micro-Community Polling
Instagram Broadcast Channels & LinkedIn Groups foster Q&A; poll results become UGC quotes in feed posts, boosting ER 15–20 %. - UGC Duet/Remix Chains
Encourage followers to remix your TikTok; algorithms love collaborative threads. - Gamified Story Sequences
Multi-slide IG Stories with quiz stickers; completion rate unlocks swipe-up discount—drives both ER and conversions. - Attention Heat-Mapping
Tools like Fanpage Karma overlay watch-time vs. frame; edit future reels around drop-off points to raise ER.
8 | Recommended Tool Stack
| Need | Tool | Highlight |
| Analytics & ER | Sprout Social, RivalIQ, Fanpage Karma | Cross-platform ER & competitor benchmarks |
| Content Ideation | AnswerThePublic, BuzzSumo | Trending questions = comment bait |
| Hook/Caption AI | Jasper, OpenAI ChatGPT + custom prompt | Generates first-sentence hook variations |
| Comment Inbox | Agorapulse, Hootsuite Streams | Single hub for multi-platform replies |
| Video Edit & Heatmap | Descript, Kapwing, VidIQ | Caption, trim, track retention curves |
9 | How WebSmarter.com Turns Engagement into Revenue
- 90-Day ER Audit – Data scientists benchmark your posts vs. vertical averages; deliver a color-coded “Engagement Opportunity Map.”
- Hook & Story Workshop – Copywriters and motion-designers craft reusable templates; clients see ER jump +42 % within eight weeks.
- Community Flywheel Setup – Automation routes top commenters into VIP Discord; referral codes seed virality.
- Real-Time ER Alerts – Looker dashboards + Slack bots flag breakout posts so teams can boost while hot.
- Quarterly Content Lab – WebSmarter strategists co-create pillar videos and carousel series tuned to platform algorithm updates.
10 | Wrap-Up: Attention Is Earned, Not Bought
Engagement Rate sits at the intersection of creativity and analytics. Nail it, and algorithms amplify you, prospects trust you, and budgets stretch further. Let it slide, and every subsequent ad dollar becomes a bandaid on a leaky funnel. With WebSmarter’s data-driven audits, template labs, and community accelerators, engagement transforms from vanity metric to growth lever.
Ready to turn likes into loyal customers?
🚀 Book a 20-minute discovery call and WebSmarter’s social-growth architects will benchmark, boost, and monetize your Engagement Rate—before your next post hits the feed.
Join us tomorrow on Tech Terms Daily as we decode another buzzword into measurable wins—one term, one clear roadmap at a time.
You must be logged in to post a comment.